How We Track Weekends
In order to determine if our weekend services are changing and to help planning in the future, we track attendance and financial giving on one convenient Google Doc.
We have a column for every service and campus. We also have a column for the total financial giving for that week. Since almost half of our giving comes during the week through (online) we calculate Sunday’s offering plus all the revenue through Saturday and include it for that week’s total. Beside each week, we have a column for miscellaneous notes. If we have a guest speaker or some other notable event that would skew attendance, we make a note of it. For example, when the time changes in the spring AND it is spring break, we make note of that so it explains why we had low attendance. Or on the other hand, if we had a popular guest speaker or singer, we will note that so we know in future.
After recording data for years, you can start to see trends in your congregation that transcend your local church. Most likely if attendance in down certain weeks, that has to do with the culture of your community. For example when our attendance is low at PromiseLand, often times other businesses like the outlet mall or football games have low attendance. This is great information to know when planning special events or vacations.
We also track what we call our generosity quotient. We take the total offering for the week and divide it by the total attendance for the day (including kids). This gives us an ‘giving per person’ amount. I’ve heard that the national average is somewhere around $25/person. By using this quotient, we can compare our giving to churches in other parts of the country.
Disclaimer: These are just gauges. They are not the definitive answer to church/spiritual health. However, coupled with other measures they can help paint a picture.
Here is what our’s looks like:
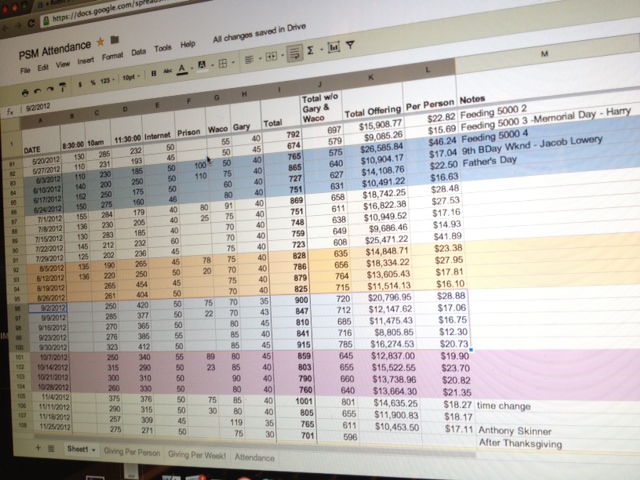
our google doc to track attendance


Leave a comment
Comments 0